
Infographics have become a cornerstone of digital marketing, especially when it comes to earning high-quality backlinks. By designing visual content that is both informative and engaging, you can attract attention from webmasters and content creators looking for valuable resources to link to. This approach is particularly effective in the context of broken link building, where you replace outdated or dead links with your own fresh, relevant content. In this guide, you’ll learn practical strategies for crafting infographics that not only get noticed but also serve as powerful assets for your link acquisition efforts.
Before diving into the step-by-step process, it’s important to understand how visual assets fit into a broader link building strategy. If you want to explore more about maximizing your SEO with this method, check out How to improve SEO with broken link building for additional insights and actionable tips.
Why Visual Content Is Essential for Broken Link Outreach
Visuals, especially linkable infographics, are highly effective in digital outreach because they simplify complex information and make it easy to share. When you offer a well-designed infographic as a replacement for a broken link, you provide real value to the site owner and their audience. This increases the likelihood of your content being accepted and linked to.
Infographics also tend to attract organic shares and mentions, multiplying your link building efforts. By focusing on topics that are relevant and in demand, you can create assets that naturally fit into existing content across the web.
Finding Broken Link Opportunities for Your Infographics
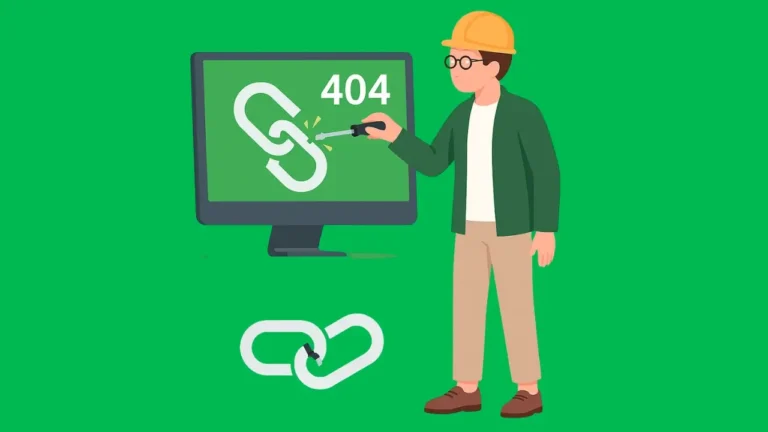
The first step in this process is to identify pages with dead links that are relevant to your niche. Tools like SEMrush’s backlink analytics can help you uncover these opportunities efficiently. Look for resource pages, blog posts, or guides that previously linked to infographics or data visualizations similar to what you can offer.
Once you have a list of targets, analyze the context of the broken links. What information were they providing? What made them valuable to the original audience? This research will guide the content and design of your replacement infographic.
Planning and Designing Infographics That Attract Links
To maximize your chances of earning backlinks, your infographic must be both visually appealing and rich in value. Here are some steps to guide your creation process:
- Research your topic thoroughly: Use data from reputable sources, and ensure your information is up-to-date and relevant to your audience.
- Focus on clarity and simplicity: Avoid clutter. Use concise text, clear headings, and logical flow to make your infographic easy to understand at a glance.
- Incorporate branding and citation: Add your logo and website URL subtly, and always credit your data sources. This builds trust and encourages others to share your work.
- Use an accessible color palette: Make sure your design is readable for all users, including those with color vision deficiencies.
- Optimize for web sharing: Export your infographic in a web-friendly format (like PNG or SVG), and ensure it loads quickly on all devices.
Remember, the goal is to provide something so useful and visually engaging that webmasters will want to link to it as a resource for their own readers.
How to Promote Your Infographic for Maximum Link Acquisition
Creating a great infographic is only half the battle. The next step is outreach—getting your visual asset in front of the right people. Here’s how to approach this phase:
- Personalize your outreach emails: Reference the specific broken link and explain how your infographic is a relevant and improved replacement.
- Highlight the value: Briefly describe what makes your infographic unique—whether it’s updated data, a new perspective, or a more attractive design.
- Make it easy to use: Provide an embed code or downloadable link, so webmasters can quickly add your infographic to their content.
- Follow up respectfully: If you don’t receive a response, a polite follow-up can increase your chances of success.
For more on integrating visual assets with broader outreach strategies, see How to combine broken link building with content marketing.

Tips for Making Your Infographics More Linkable
To ensure your visual content stands out and attracts links, consider these additional tips:
- Choose evergreen topics: Focus on subjects that remain relevant over time, increasing the lifespan and link potential of your infographic.
- Tell a story: Structure your data and visuals in a way that guides viewers through a narrative, making the information memorable and shareable.
- Encourage sharing: Add social sharing buttons or prompts near your infographic to make it easy for others to distribute your content.
- Monitor performance: Use analytics tools to track which infographics earn the most links and refine your approach based on what works.
If you’re scaling your outreach, you might find How to scale broken link building campaigns helpful for managing multiple projects efficiently.
Common Pitfalls to Avoid When Building Links with Infographics
While creating linkable infographics can be highly effective, there are some mistakes that can undermine your efforts:
- Overloading with information: Too much data can overwhelm viewers. Focus on the most impactful points.
- Poor design quality: Amateurish graphics or hard-to-read layouts reduce credibility and shareability.
- Neglecting outreach: Even the best infographic won’t earn links if you don’t actively promote it to relevant sites.
- Ignoring technical SEO: Make sure your infographic is indexable and loads quickly, or you risk missing out on organic traffic.
For more on what to watch out for, see what mistakes to avoid in broken link building.
FAQ: Linkable Infographics and Broken Link Building
What makes an infographic “linkable” for outreach?
A linkable infographic is one that provides unique value, is visually appealing, and addresses a specific need or gap in existing content. It should be easy to understand, backed by credible data, and relevant to the target audience. Including clear branding and making it simple to embed or share also increases its linkability.
How do I find websites with broken links to infographics?
Use backlink analysis tools to search for resource pages or blog posts in your niche that previously linked to infographics. Look for links that return 404 errors or point to outdated resources. Tools like SEMrush’s backlink analytics can streamline this process.
Should I create a new infographic for every broken link I find?
Not necessarily. If multiple sites linked to a similar resource, one high-quality infographic can serve as a replacement for several broken links. However, if the topics are very different, tailor your content to match the specific needs of each opportunity for better results.
How do I measure the success of my infographic link building efforts?
Track the number of backlinks earned, referral traffic, and social shares generated by your infographic. Use analytics tools to monitor which outreach emails result in successful link placements and refine your strategy based on these insights.
Conclusion
Leveraging infographics for broken link building is a proven way to earn high-quality backlinks, boost your site’s authority, and provide lasting value to the web community. By focusing on relevant topics, clear design, and targeted outreach, you can create visual content that not only replaces broken resources but also stands out as a go-to reference in your industry. For more advanced tactics, don’t forget to explore how to use Google Search Console for broken links as part of your ongoing strategy.